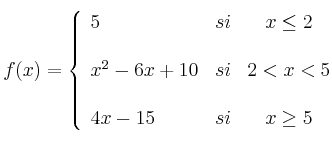
-
Representa gráficamente las siguientes funciones:
– a) 
– b) 
-
Calcula los puntos de corte con los ejes de coordenadas de las siguientes funciones:
– a) 
– b) 
-
Indica si existe simetría en las siguientes funciones:
– 
– 
– 
– 
-
Representa gráficamente la función:

-
Representa gráficamente la función:
